As midterm elections approach in the United States, one of the key issues Republicans have been keen to focus on is crime.
They have spoken of record crime levels in Democrat-run cities, and accused them of being “the party of crime” under President Joe Biden.
We’ve taken a look at the violent crime trends across the US.
Is violent crime going up?
According to data released by the FBI, violent crime fell by an estimated 1% in 2021 compared with the previous year. However, the number of murders increased by more than 4%.
The fall in violent crime was largely driven by a drop of nearly 9% in the robbery rate over that period.
According to one analysis, nearly 40% of law enforcement agencies have failed to report their 2021 crime figures – so we may only have a partial picture of the most recent crime rates. It’s also important to point out that last year, the FBI switched to a new data collection system.
The longer-term trend for violent crime in the US since the 1990s has been generally downwards, although over the past few years it has remained relatively stable, according to FBI data.
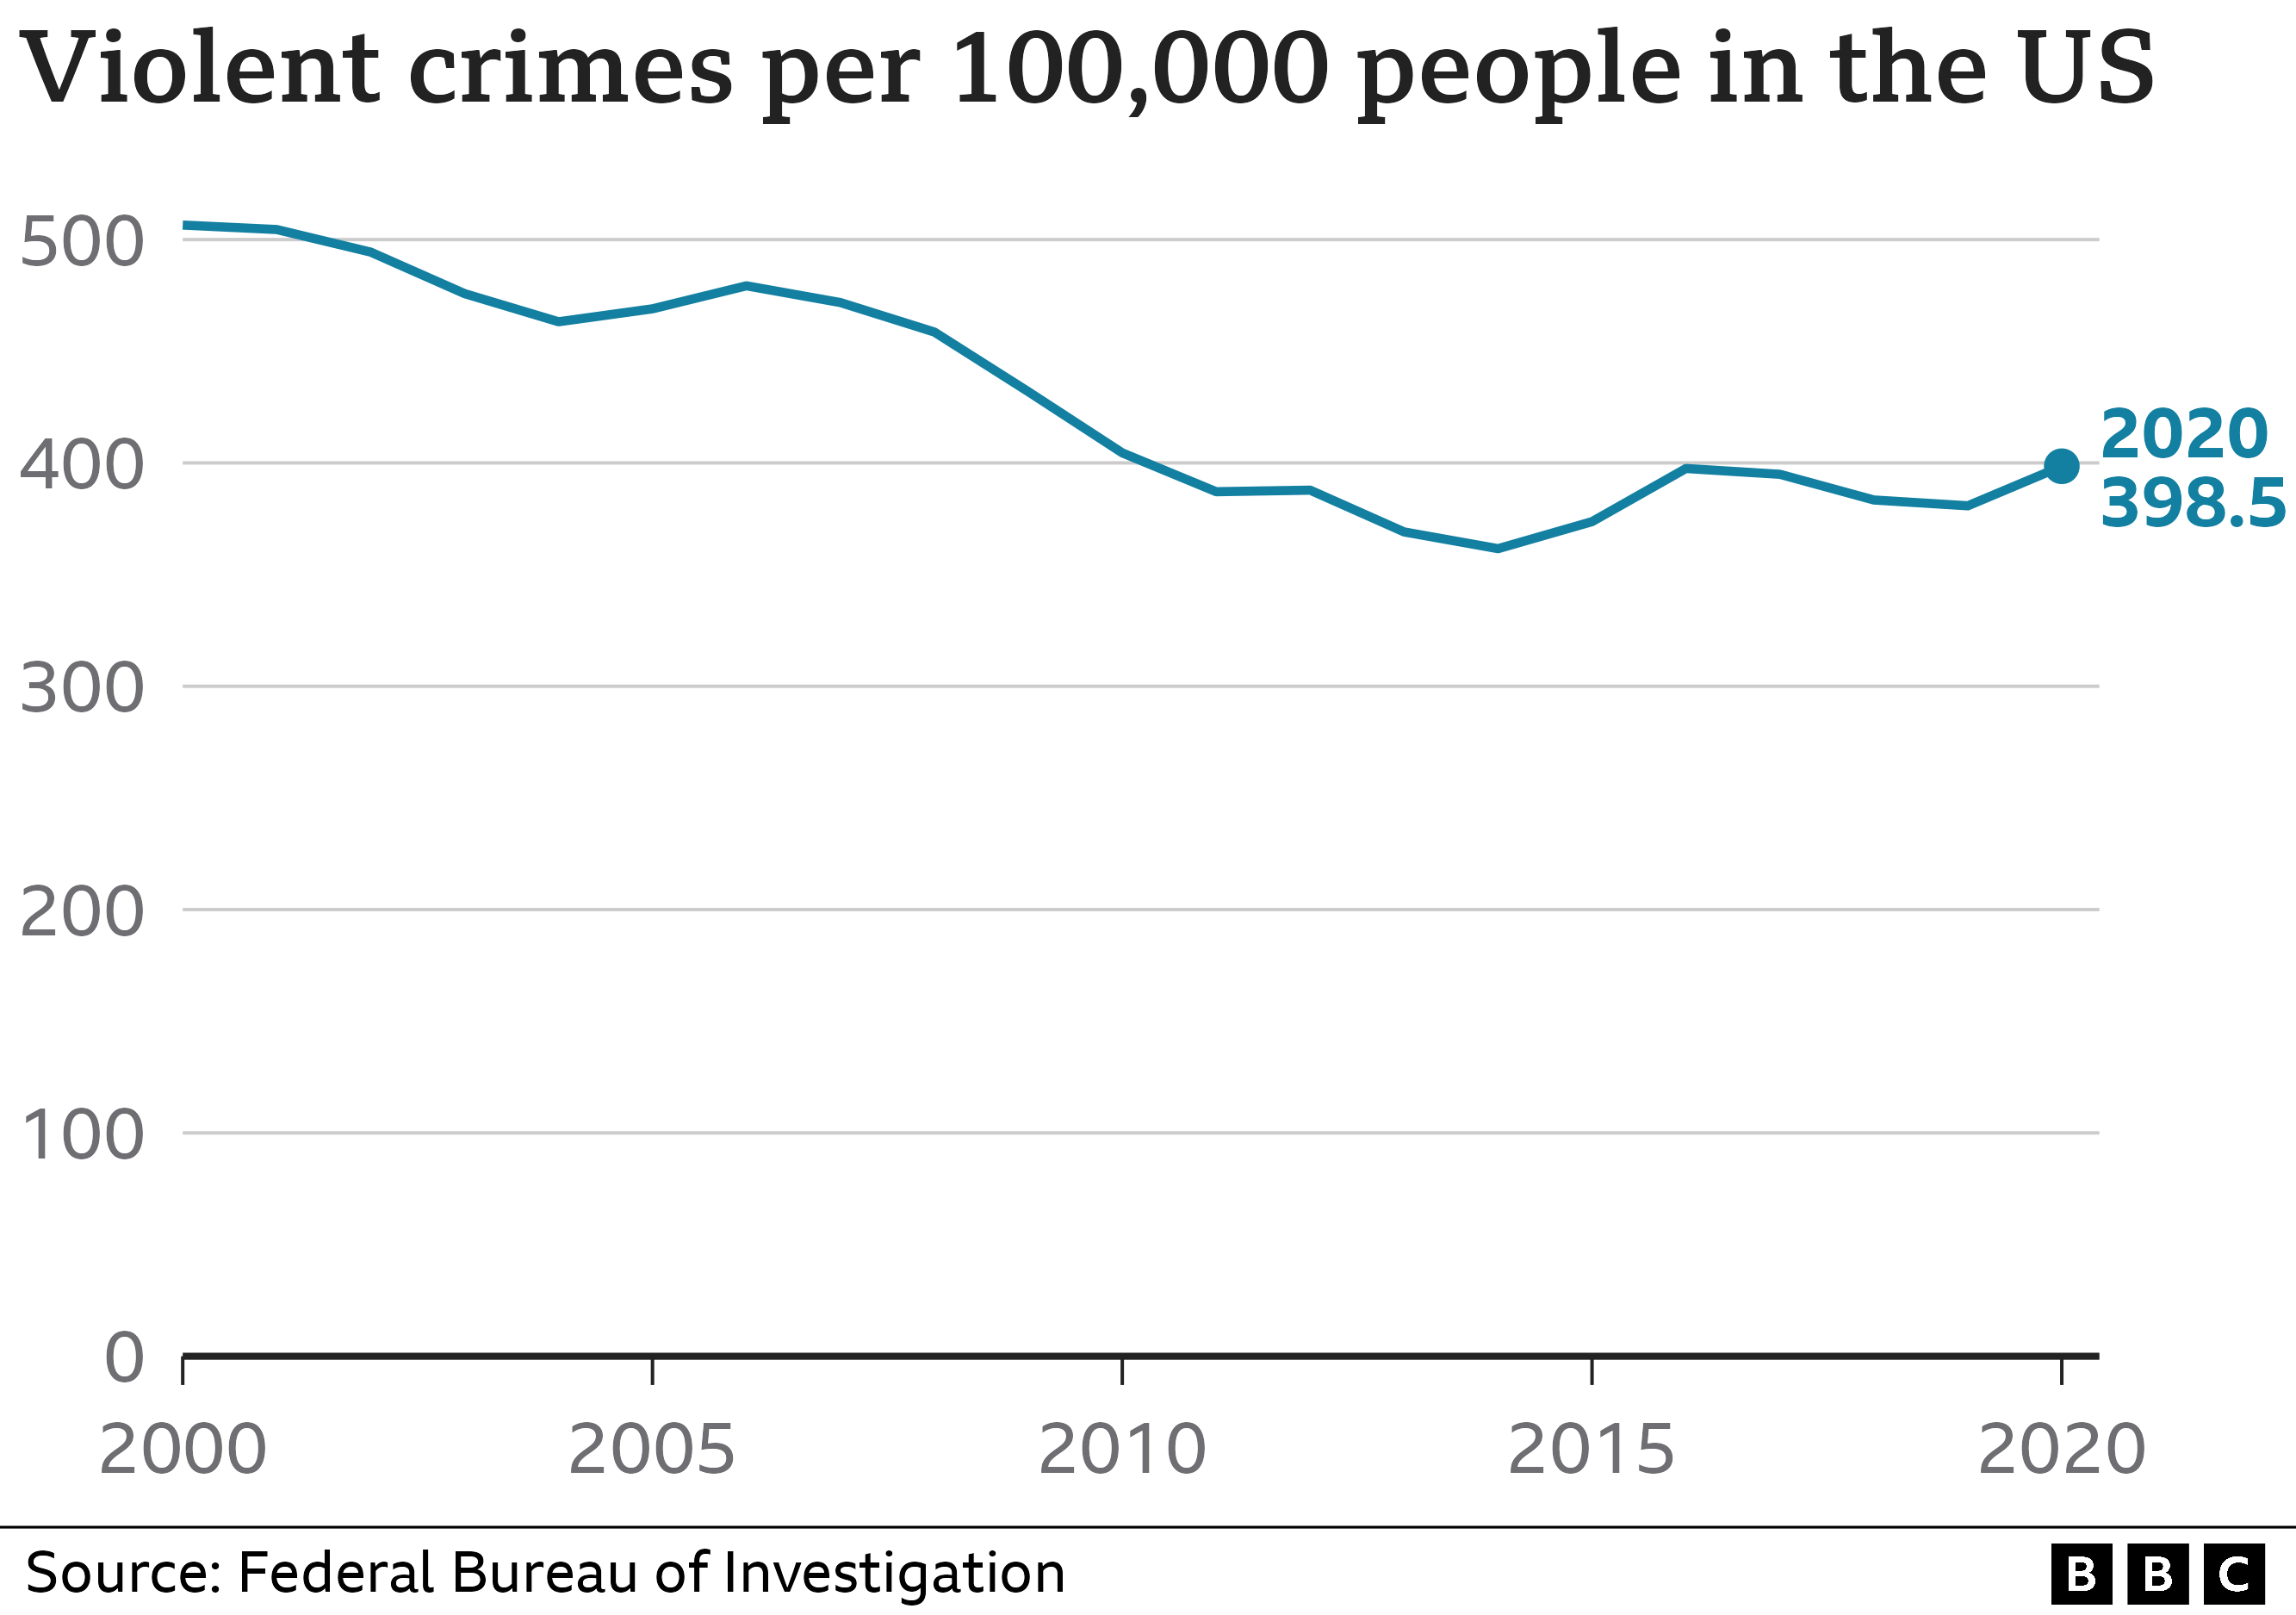
In 2000, there were over 500 violent offenses recorded per 100,000 people. In 2020, that figure was down to just under 400 – a 20% reduction over the period.
Police departments across the US define violent crime in slightly different ways, but the data generally includes murder, robbery, assault and rape.
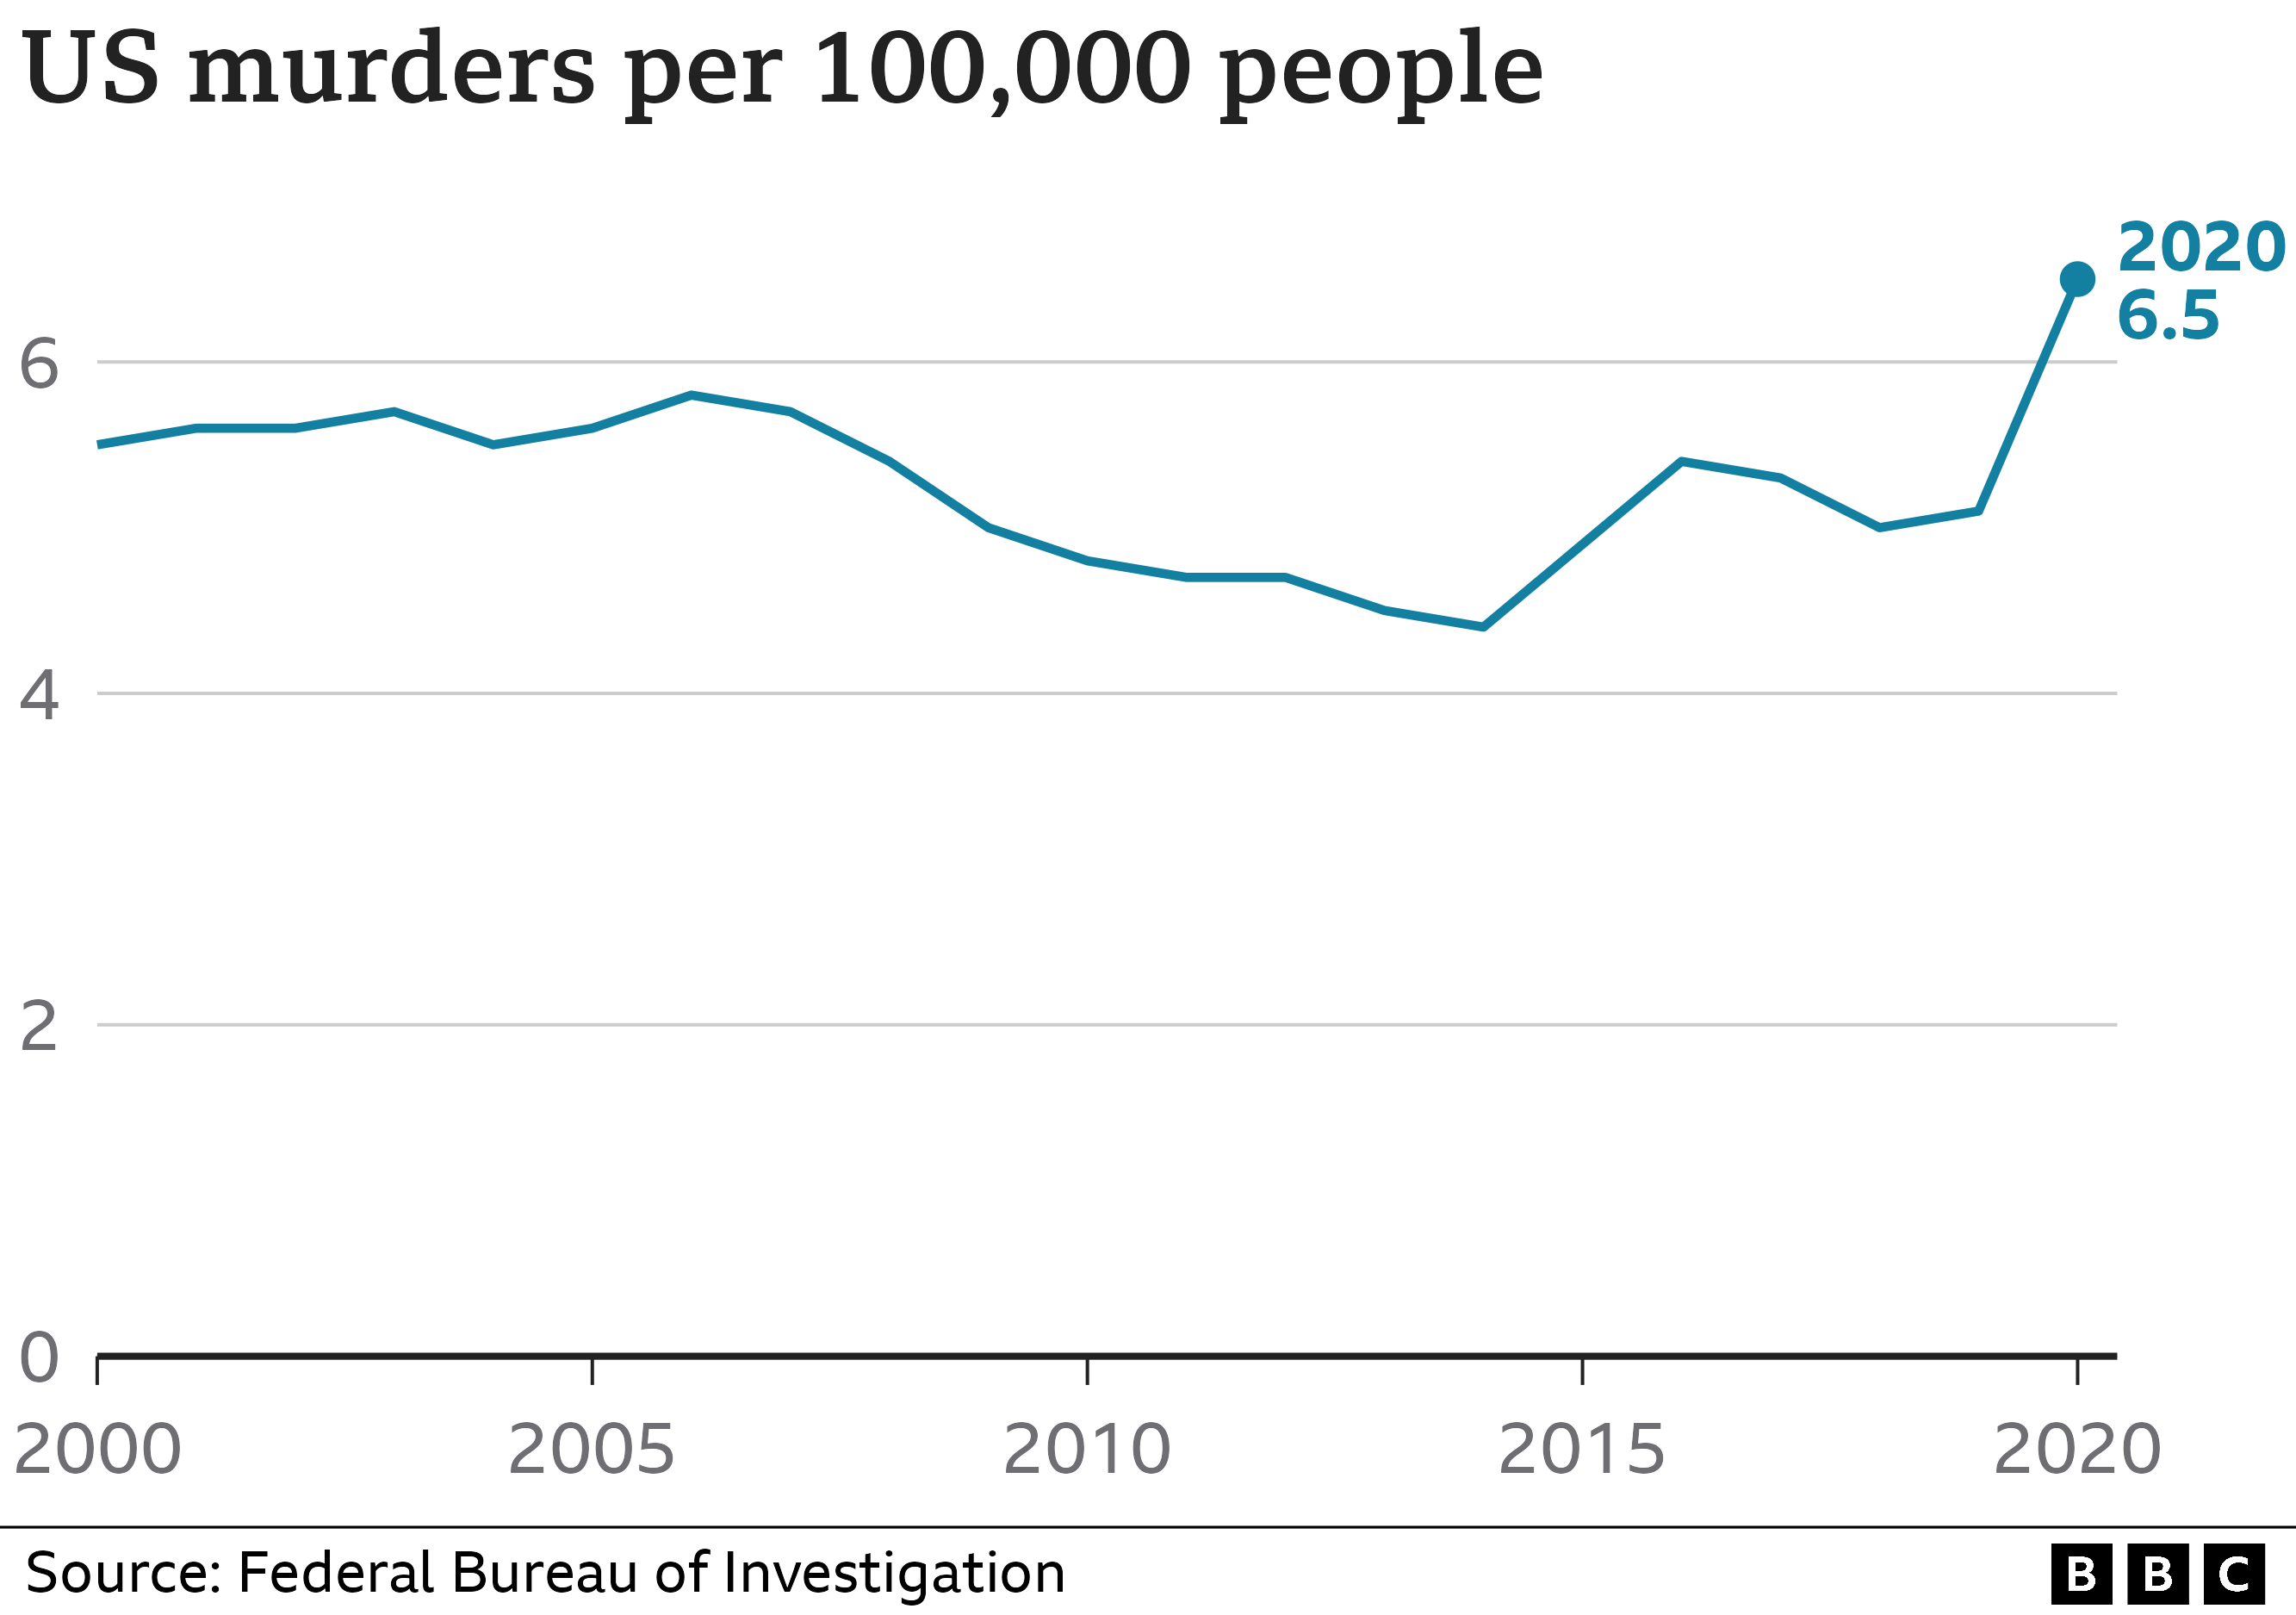
Between 2019 and 2020, FBI figures show a significant increase in murders per 100,000 people – going up to 6.5 from 5.1 – a jump of 27%.
Where is violent crime going up?
Major US cities have tended to follow the national trend in becoming safer since the 1990s, but some have also seen a sharp rise in the number of murders in recent years.
Although in some of the biggest cities in the US known for their high rates of violent crime, the rate of increase in murders has slowed.
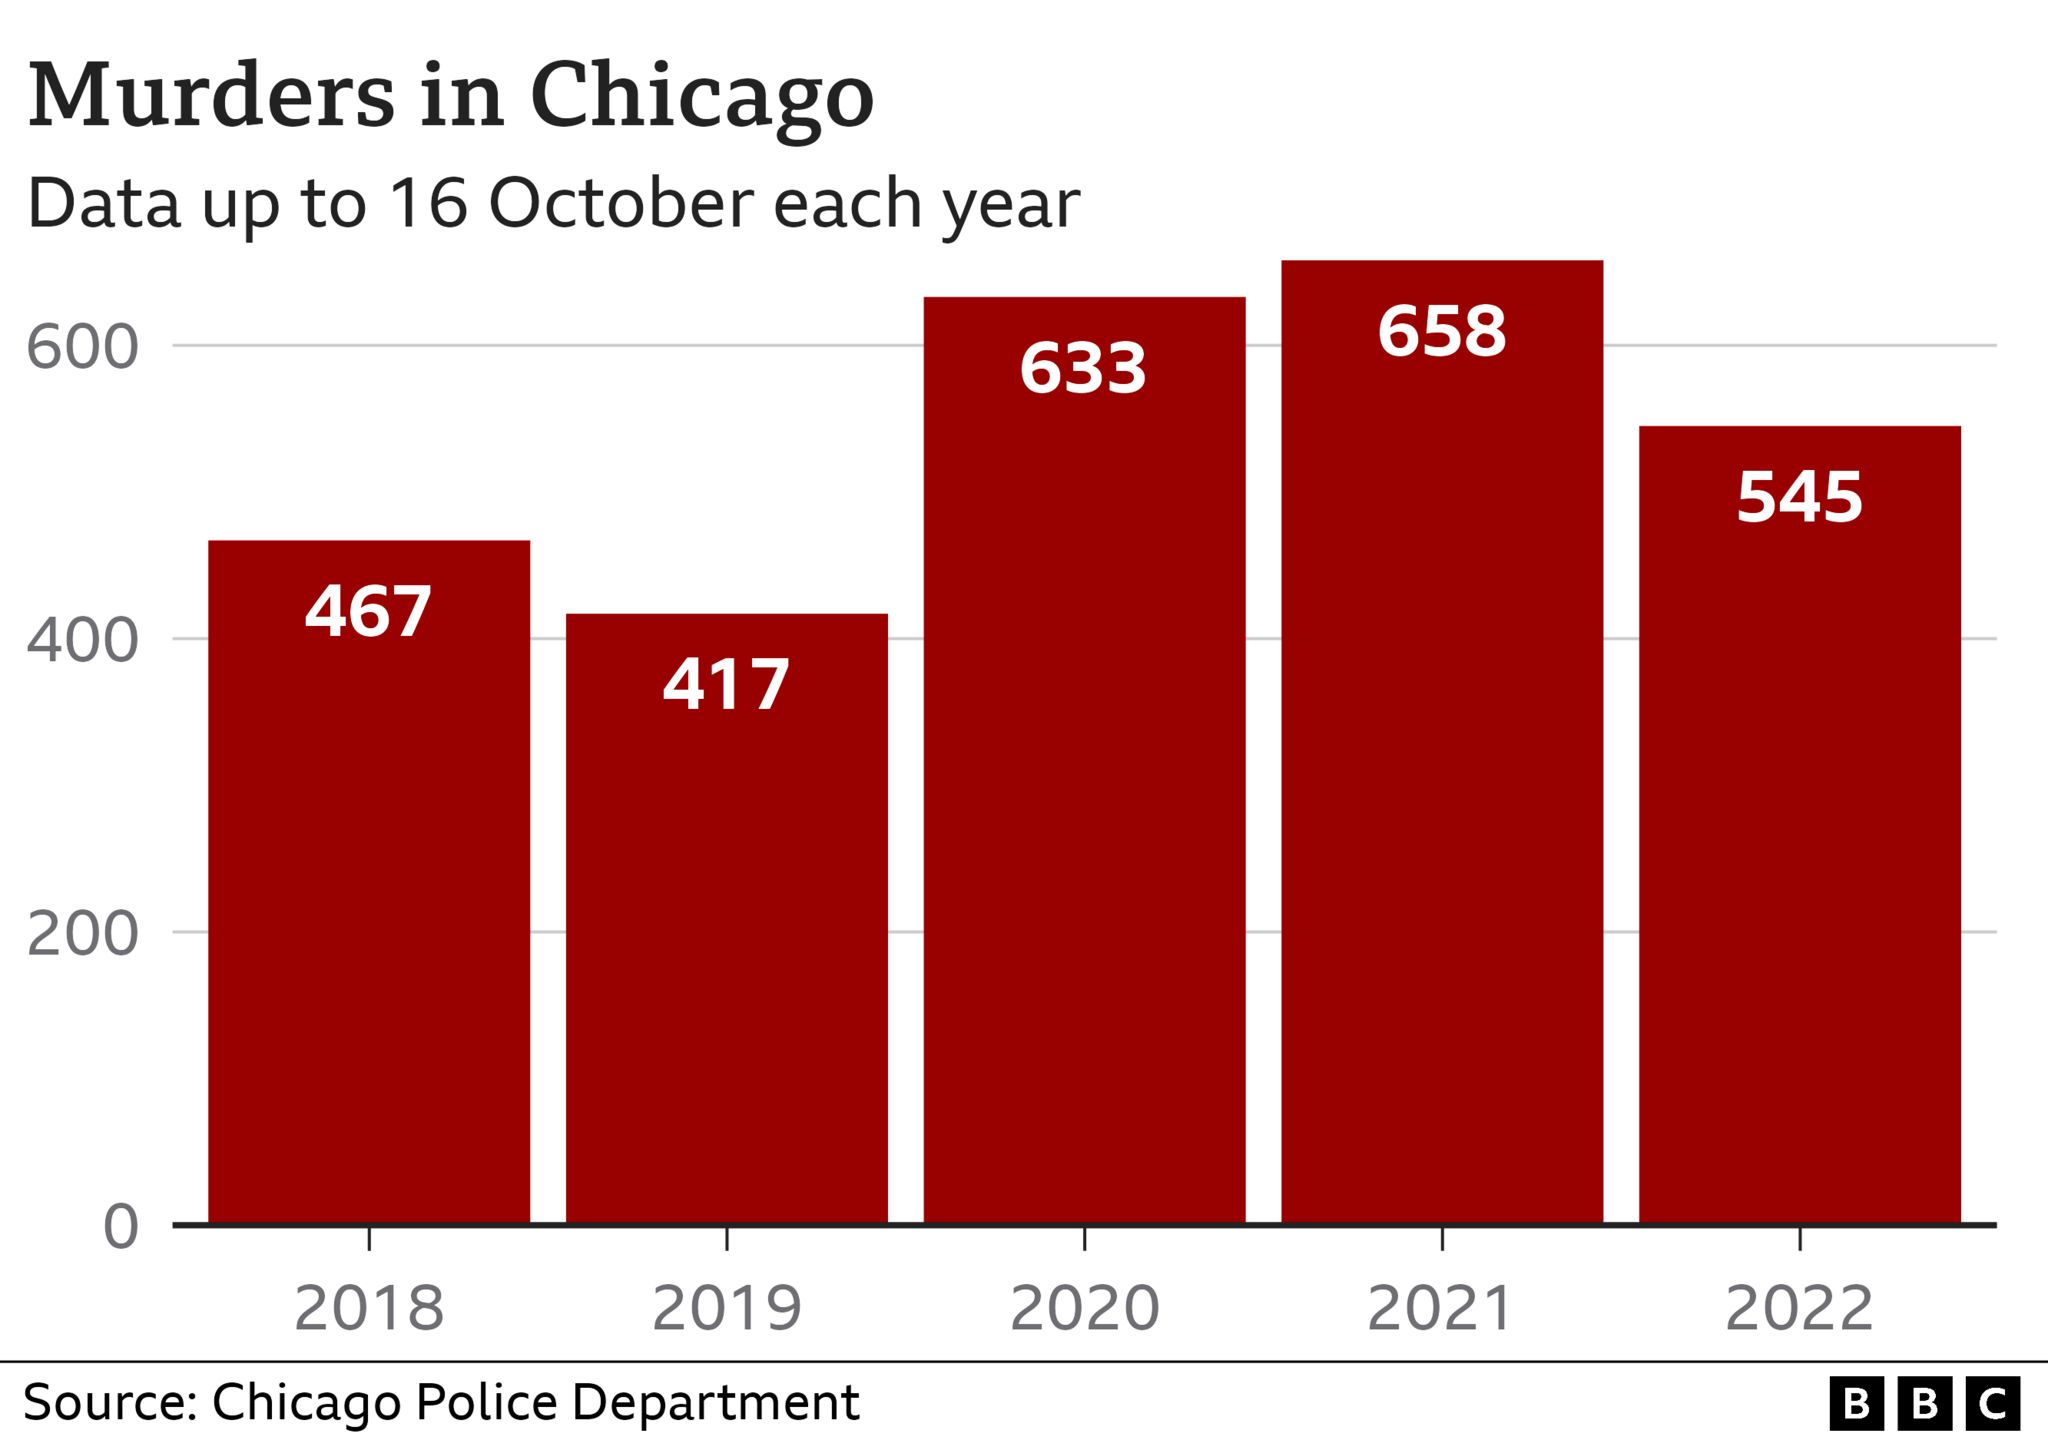
Chicago has had one of the worst records for murders in the US, and saw a big increase from 2019 to 2020 (up nearly 55%) but a much smaller rise in 2021 (up just 3%).
And this year, the data up to mid-October shows a significant decrease in the number of murders recorded by the police department, compared to the same period in previous years.
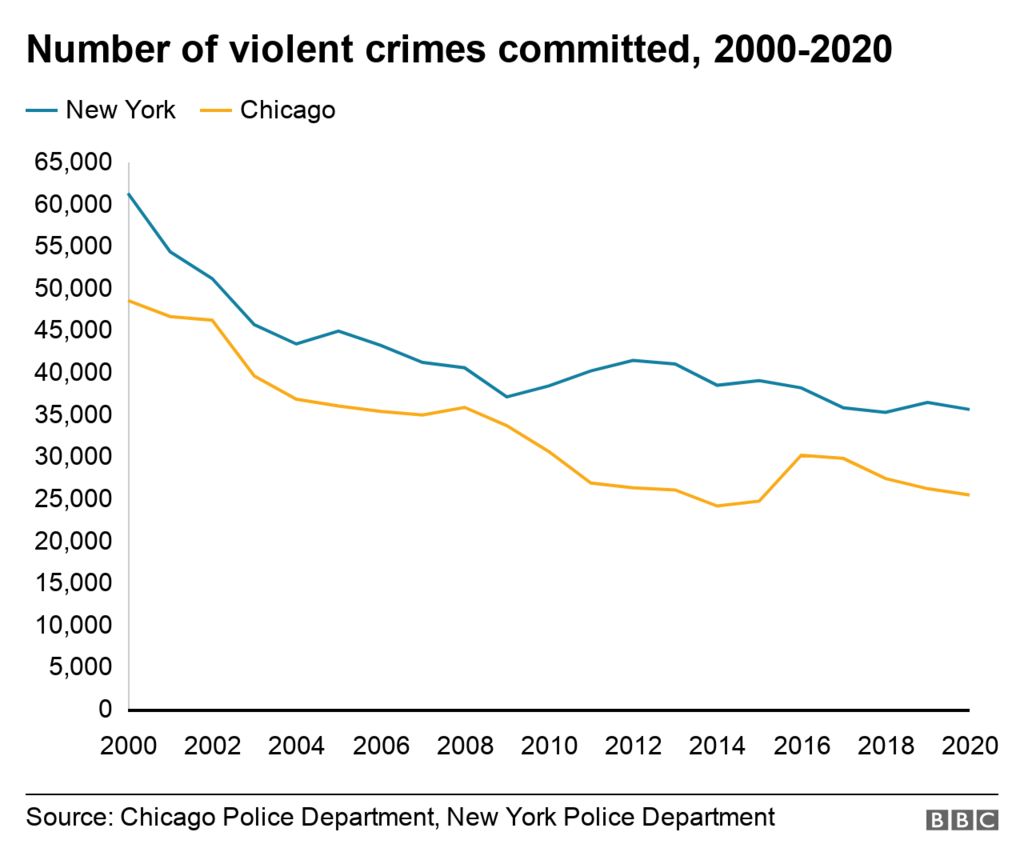
Similarly, in New York, which saw a big increase in murders between 2019 and 2020, there was a much smaller rise from 2020-2021.
Data for 2022 is incomplete, but what there is shows the murder rate decreasing.
The picture does vary across the country, however.
Last December, one US media report said a dozen cities in 2021 had broken records for the numbers of murders, based on data from their local police departments.
The New York Times looked at 37 cities across the US with data for the first three months of 2021, and said that overall there had been an 18% increase in murders compared with the same time period in 2020.
But it warned that due to the FBI changing the way crime figures are reported, it could be difficult to identify national trends after that.
There’s also a delay in reporting by the FBI, which means the most recent figures are not yet available.
However, a report in August this year for the Major Cities Chiefs Association, which represents law and order officials from the largest US cities, looked at data for 70 urban areas for the first half of 2022 compared with the same period in 2021.
They found that there were increases in murders in nearly 30 areas – including cities like Atlanta, Baltimore, Dallas, Denver, Milwaukee, New Orleans and Washington DC – but the total number of homicides for all 70 areas was slightly down for that period.
There’s similar trend identified by a Council of Criminal Justice report from July, which looked at 10 categories of violent, property or drug offences in 29 cities.
They found that the number of homicides declined slightly in the first half of 2022 compared with the same period last year, but the homicide rate is still 39% higher than the first half of 2019.
It also points out that other categories of crime such as assault and robbery have increased over that period.
